NeuroAtlas
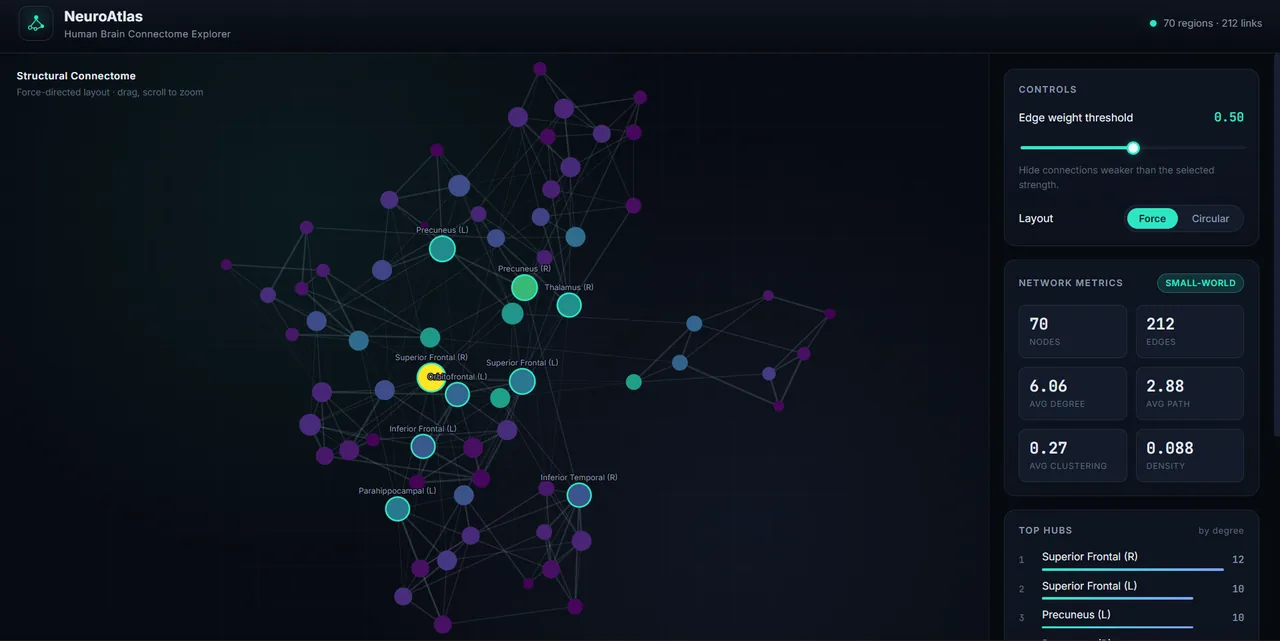
- A FastAPI and D3.js app that draws a 70-region human connectome as a force-directed graph and runs graph-theory metrics on it.
- Status
- Shipped
- Date
- May 2026
- Role
- Developer
About
Brain regions are the nodes and structural connections are weighted edges. Node size follows degree, colour follows centrality, and edge width follows connection strength. Drag the threshold slider and the backend rebuilds the graph from only the edges at or above that weight, then reports node and edge counts, average degree, path length, clustering, density and the top hubs. A small-world badge compares clustering and path length against an equivalent random graph and turns on when sigma exceeds 1. Click a region to see its degree, betweenness, clustering and strongest neighbours, or switch from the force layout to a circular one. The backend checks a disk cache, then the Allen Brain Atlas REST API. That API exposes the structure ontology but no weighted human connectivity matrix, so the demo falls back to a bundled 70-region small-world connectome that a script regenerates the same way every time. NetworkX computes the metrics, and one Docker container serves the API and the frontend on Hugging Face Spaces.